Tools for graphing: GNUPlot
Gnuplot main page is a command-line driven graphing utility for Linux, OS/2, MS Windows. The source code is copyrighted but freely distributed (i.e., you don’t have to pay for it). It was originally created to allow scientists and students to visualize mathematical functions and data interactively, but has grown to support many non-interactive uses such as web scripting. It is also used as a plotting engine by third-party applications like Octave. Gnuplot has been supported and under active development since 1986.
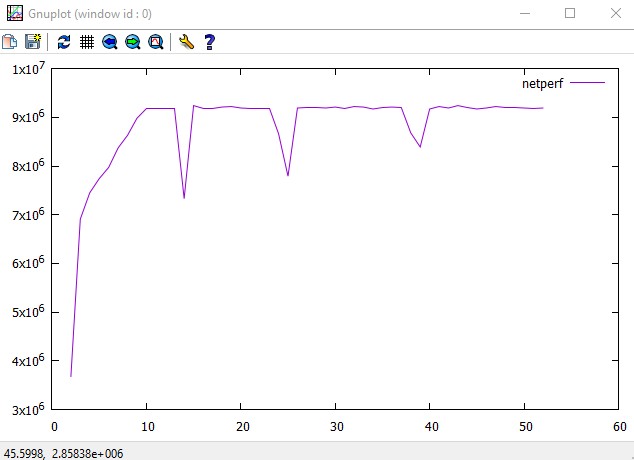
There are a lot of examples demo gallery to for new comers to follow. Here I illustrated a simple example. The data comes from “ifstat” output, and I want to create a line graph according to that data. I can write command like:
1
2
plot 'C:\home\Study\gnuplot_test1.dat' using 2 title 'netperf' with lines
# plot command is used to create 2-d graph, splot is used to create 3-d.
You can get the test data here